Obesity in America
When considering short and long term healthcare costs it’s important to look at areas where we can control the costs with changes that don’t even need to go through legislative process. The easy target is our behavior in understanding how to eat and live healthy. This in turn can reduce long term costs and yield quality of life benefits.
Economic Consequences
Overweight and obesity and their associated health problems have a significant economic impact on the U.S. health care system (USDHHS, 2001). Medical costs associated with overweight and obesity may involve direct and indirect costs (Wolf and Colditz, 1998; Wolf, 1998). Direct medical costs may include preventive, diagnostic, and treatment services related to obesity. Indirect costs relate to morbidity and mortality costs. Morbidity costs are defined as the value of income lost from decreased productivity, restricted activity, absenteeism, and bed days. Mortality costs are the value of future income lost by premature death.National Estimated Cost of Obesity
The medical care costs of obesity in the United States are staggering. In 2008 dollars, these costs totaled about $147 billion (Finkelstein, 2009).Health Consequences
Research has shown that as weight increases to reach the levels referred to as “overweight” and “obesity,”* the risks for the following conditions also increases:1- Coronary heart disease
- Type 2 diabetes
- Cancers (endometrial, breast, and colon)
- Hypertension (high blood pressure)
- Dyslipidemia (for example, high total cholesterol or high levels of triglycerides)
- Stroke
- Liver and Gallbladder disease
- Sleep apnea and respiratory problems
- Osteoarthritis (a degeneration of cartilage and its underlying bone within a joint)
- Gynecological problems (abnormal menses, infertility)
U.S. Obesity Trends
National Obesity Trends
About one-third of U.S. adults (33.8%) are obese. Approximately 17% (or 12.5 million) of children and adolescents aged 2—19 years are obese. [Data from the National Health and Examination Survey (NHANES)]Trends by State 1985–2010
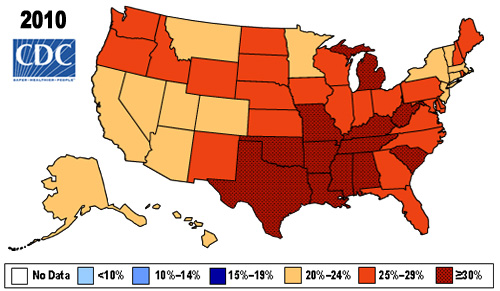
During the past 20 years, there has been a dramatic increase in obesity in the United States and rates remain high. In 2010, no state had a prevalence of obesity less than 20%. Thirty-six states had a prevalence of 25% or more; 12 of these states (Alabama, Arkansas, Kentucky, Louisiana, Michigan, Mississippi, Missouri, Oklahoma, South Carolina, Tennessee, Texas, and West Virginia) had a prevalence of 30% or more. PDF Obesity Trends Among U.S. Adults Between 1985 and 2010 Link to animated map that below shows the United States obesity prevalence from 1985 through 2010.
| 2010 State Obesity Rates | |||||||
|---|---|---|---|---|---|---|---|
| State | % | State | % | State | % | State | % |
| Alabama | 32.2 | Illinois | 28.2 | Montana | 23.0 | Rhode Island | 25.5 |
| Alaska | 24.5 | Indiana | 29.6 | Nebraska | 26.9 | South Carolina | 31.5 |
| Arizona | 24.3 | Iowa | 28.4 | Nevada | 22.4 | South Dakota | 27.3 |
| Arkansas | 30.1 | Kansas | 29.4 | New Hampshire | 25.0 | Tennessee | 30.8 |
| California | 24.0 | Kentucky | 31.3 | New Jersey | 23.8 | Texas | 31.0 |
| Colorado | 21.0 | Louisiana | 31.0 | New Mexico | 25.1 | Utah | 22.5 |
| Connecticut | 22.5 | Maine | 26.8 | New York | 23.9 | Vermont | 23.2 |
| Delaware | 28.0 | Maryland | 27.1 | North Carolina | 27.8 | Virginia | 26.0 |
| District of Columbia | 22.2 | Massachusetts | 23.0 | North Dakota | 27.2 | Washington | 25.5 |
| Florida | 26.6 | Michigan | 30.9 | Ohio | 29.2 | West Virginia | 32.5 |
| Georgia | 29.6 | Minnesota | 24.8 | Oklahoma | 30.4 | Wisconsin | 26.3 |
| Hawaii | 22.7 | Mississippi | 34.0 | Oregon | 26.8 | Wyoming | 25.1 |
| Idaho | 26.5 | Missouri | 30.5 | Pennsylvania | 28.6 | ||
County-Specific Obesity, Diabetes, and Physical Inactivity Prevalence
Combining county-level estimates for obesity, diagnosed diabetes, and leisure time physical inactivity for 2008 show that counties with high levels of all three conditions are primarily concentrated in the South and Appalachia, while counties with low levels of all three conditions are primarily concentrated in the Northeast and West. For more, see:Data and Statistics
Obesity rates among all children in the United States
(Data from the National Health and Nutrition Examination Survey) [Read article]- Approximately 17% (or 12.5 million) of children and adolescents aged 2—19 years are obese.
- Since 1980, obesity prevalence among children and adolescents has almost tripled.
- There are significant racial and ethnic disparities in obesity prevalence among U.S. children and adolescents. In 2007—2008, Hispanic boys, aged 2 to 19 years,were significantly more likely to be obese than non-Hispanic white boys, and non-Hispanic black girls were significantly more likely to be obese than non-Hispanic white girls.
Obesity rates among low-income preschool children
(Data from the Pediatric Nutrition Surveillance System)- 1 of 7 low-income, preschool-aged children is obese. [Check out this Fact Sheet to learn more (PDF-1.5Mb)]
- County obesity rates are variable within states. Even states with the lowest prevalence of obesity have counties where many low-income children are obese and at risk for chronic disease.
2009 State Prevalence Among Low-Income Children Aged 2 to 4 Years
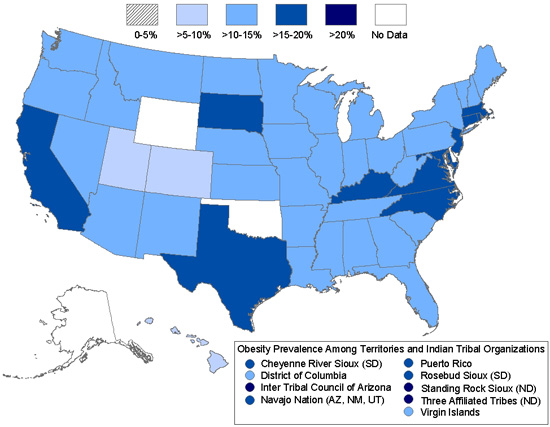
2009 State Prevalence Among Low-Income Children Aged 2 to 4 Years
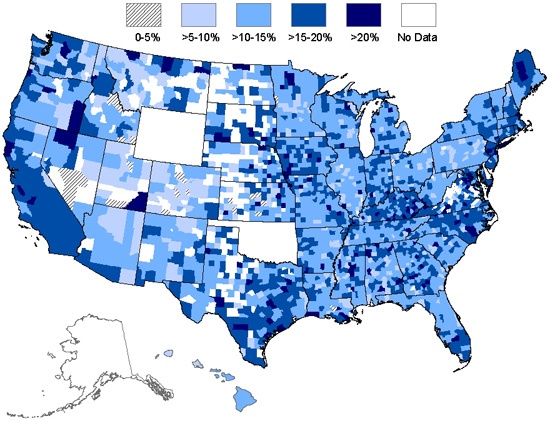
2007—2009 County Obesity Prevalence Among Low-Income Children Aged 2 to 4 Years
Diabetes Trend Data as of 2008
County Level Estimates of Leisure-Time Physical Inactivity — U.S. Maps
2008 Age-Adjusted Estimates of the Percentage of Adults
Unite America with The Centrist Party
- Enough is enough. We must unite to reclaim our government. Join the Centrist Party. Work together to heal our nation and return balance in governance and common sense for the nation and the people.
The Centrist News
Check out Centrist News & Perspectives for centrist media intelligence:
Recent Comments